Visual 2C02: Difference between revisions
(Add link to PPU timing diagram) |
(the "unused box" is actually used now - it shows the pixels being rendered, using an RGB palette (though it doesn't emulate Emphasis yet)) |
||
| Line 37: | Line 37: | ||
Memory display. Can also be used to modify memory. | Memory display. Can also be used to modify memory. | ||
* 3F00-3F1F — Palettes. Some of the cells are mirrors. | * 3F00-3F1F — Palettes. Some of the cells are mirrors. Only visible if "Show palette RAM contents" is checked in section 5. | ||
* S000-S11F — OAM. For example, S000 holds the y position for sprite 0. | * S000-S11F — OAM. For example, S000 holds the y position for sprite 0. Only visible if "Show sprite RAM contents" is checked in section 5. | ||
** S000-S0FF — Primary OAM. | ** S000-S0FF — Primary OAM. | ||
** S100-S11F — Secondary OAM (normally not directly accessible). | ** S100-S11F — Secondary OAM (normally not directly accessible). | ||
| Line 48: | Line 48: | ||
Video output waveform display, based on the ''vid_'' node. You will at least see some level changes and squiggly stuff here near the end of each scanline, which is the NTSC hsync and colorburst. | Video output waveform display, based on the ''vid_'' node. You will at least see some level changes and squiggly stuff here near the end of each scanline, which is the NTSC hsync and colorburst. | ||
The square box to the right (not labeled in the current screenshot) shows the actual video being rendered by the PPU by extracting the pixel values being fed into the NTSC luma/chroma generators and drawing them using a slightly modified version of the PlayChoice-10 RGB palette. | |||
=== Navigation (section 5) === | === Navigation (section 5) === | ||
Revision as of 13:36, 7 May 2020
Note: Visual 2A03 and Visual 2C02 are hosted on a limited uplink, so please avoid e.g. shift-reloading them frequently. Normal reloading should work fine and should properly catch any updates to the data files.
Visual 2C02 is a hardware-level simulator of the NTSC PPU by Quietust, using the same core as the Visual 6502 project. It can be used to figure out exactly how the PPU operates under various circumstances.
Manual
This page covers the basic user interface and tracing functionality. For making sense of the circuit display, see this tutorial.
Section overview

Running (section 1)
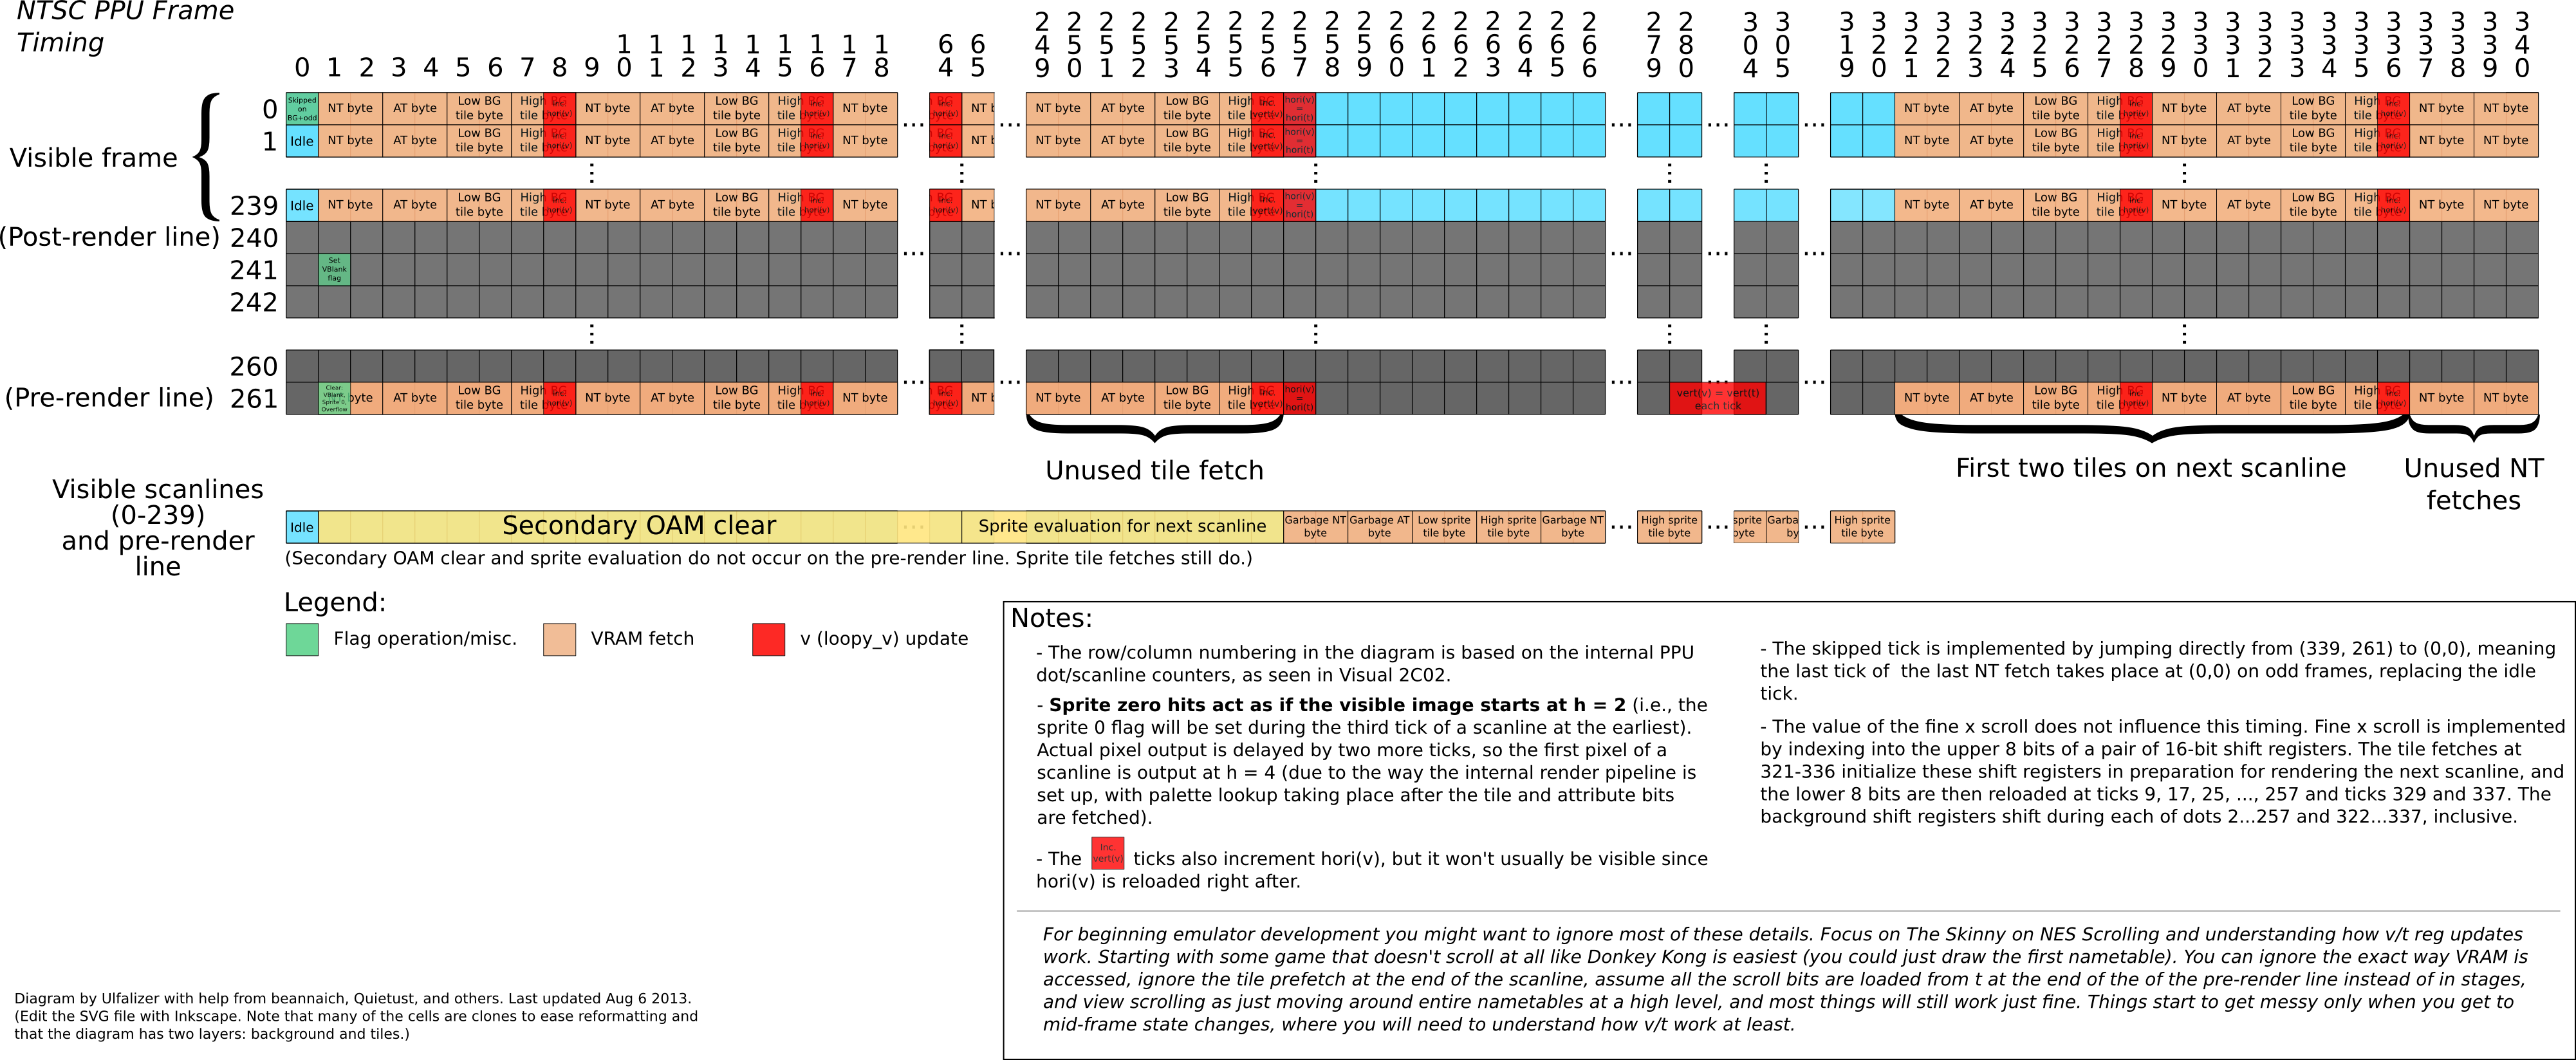
The controls in this section start, stop, and reset the simulation. The Scanline: and Pixel: status displays are based on internal PPU counters and should be self-explanatory (see this timing diagram for what operation is carried out at each dot). The starting state to use when resetting the simulation can be selected with the radio buttons in section 5.
Currently supported reset states:
- Power-on
- Immediately after pulsing the PPU's RESET input (otherwise labeled the /SYNC pin). Note that chip operation will be severely limited in this state, and sprite RAM will be in an indeterminate state (neither 0 nor 1) until it is properly initialized.
- Pre-render scanline, even frame
- The chip is powered on, all sprite and palette RAM has been initialized, and the chip has been simulated for 260 complete scanlines, leaving it at the very beginning of the pre-render scanline.
- Pre-render scanline, odd frame
- Same as the above, but the pre-render scanline will end one cycle early.
- Post-render scanline, odd frame
- The above state after 241 scanlines of simulation, leaving it 1 scanline before VBLANK begins.
Register access (section 2)
This is a list of register accesses to be carried out, going in sequence from top to bottom. (The simulated 2C02 isn't attached to any other simulated devices.)
For example, W 1 1e decodes as write $1E to $2001. Reads are included as they can be significant for some registers - in this case, the "value" column will be filled in with whatever was read from the register.
Register accesses can be removed by clicking on the '-' and added by clicking on the '+'. A '-' in the R/W colum means a delay (use the numpad to input the '-'), where e.g. 1 23 as the numeric values means 0x123 master half-cycles. The '*' shows the current access, and can be clicked to jump to that point in the sequence.
Memory (section 3)
Memory display. Can also be used to modify memory.
- 3F00-3F1F — Palettes. Some of the cells are mirrors. Only visible if "Show palette RAM contents" is checked in section 5.
- S000-S11F — OAM. For example, S000 holds the y position for sprite 0. Only visible if "Show sprite RAM contents" is checked in section 5.
- S000-S0FF — Primary OAM.
- S100-S11F — Secondary OAM (normally not directly accessible).
- 0000-03FF — Pattern tables. This 1KB segment is mirrored eight times to fill out the entire CHR space.
- 2000-23FF — Nametables. The simulation uses a kind of "one-screen low" mirroring, and the data here is mirrored to fill out the entire nametable space.
- This layout for pattern and name tables happens to be the same as the PPU A13 variant of iNES Mapper 218.
Video waveform display (section 4)
Video output waveform display, based on the vid_ node. You will at least see some level changes and squiggly stuff here near the end of each scanline, which is the NTSC hsync and colorburst.
The square box to the right (not labeled in the current screenshot) shows the actual video being rendered by the PPU by extracting the pixel values being fed into the NTSC luma/chroma generators and drawing them using a slightly modified version of the PlayChoice-10 RGB palette.
Pretty self-explanatory. Node numbers or node names (e.g. "spr0_hit") can be entered in the Find: edit box to locate them in the diagram.
Tracing (section 6)
Tracing of node values. Additional nodes to trace can be added in the Trace these too: edit box, separated by either spaces or commas (e.g. "spr0_hit tile_l vid_" or "spr0_hit,tile_l,vid_").
The cycle column is based on the master clock, which the PPU divides by four. Each line in the trace corresponds to a half-cycle, so there are 4*2 = 8 lines per PPU tick.
Finding nodes to trace
A list of nodes can be found in http://www.qmtpro.com/~nes/chipimages/visual2c02/nodenames.js . For nodes that have many bits, e.g. finex0, finex1, finex2, you can trace all of them at once by using "finex" as the node name.
Improving performance
Turning off tracing and unticking Animate during simulation and Show sprite RAM contents can massively speed up the simulation.
Tutorial: Outputting some pixels
1. Put 81 at pattern table address 0000. This will make the palette index for each pixel of the first row of the first tile, in order, '10000001'. (Putting 81 at 0008 as well would make it '30000003', etc.)
(Since the nametables are initialized to 0 by default, this is the tile that will be used for all the background tiles by default.)
2. Change the value at 3F01, which is the BG palette entry that will be used. 20 seems to work fine.
3. Run the simulation (and note the Performance section). The first line is the pre-render line, so nothing will be seen here. At scanline 1, you should see some pixels being output in the waveform display corresponding to the 81 pattern.
Some things to look out for
- Note that the default register writes might move around sprite 0 and do other stuff, so you might have to remove some of them or manually modify memory later to get the state you want.
- There's a bunch of sprites sitting at (0,0). If sprites are enabled and all use a black tile, this means you will see black for the first 8 pixels of scanlines 1-8. (Sprites don't start drawing until scanline 1 at the earliest since the y OAM coordinate is one less than the actual position.)