File:Quadrature demodulation.svg

Original file (SVG file, nominally 1,440 × 810 pixels, file size: 86 KB)
Summary
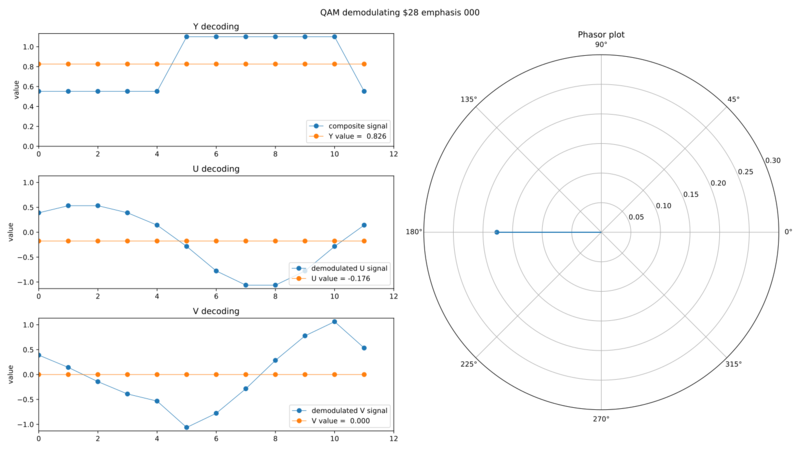
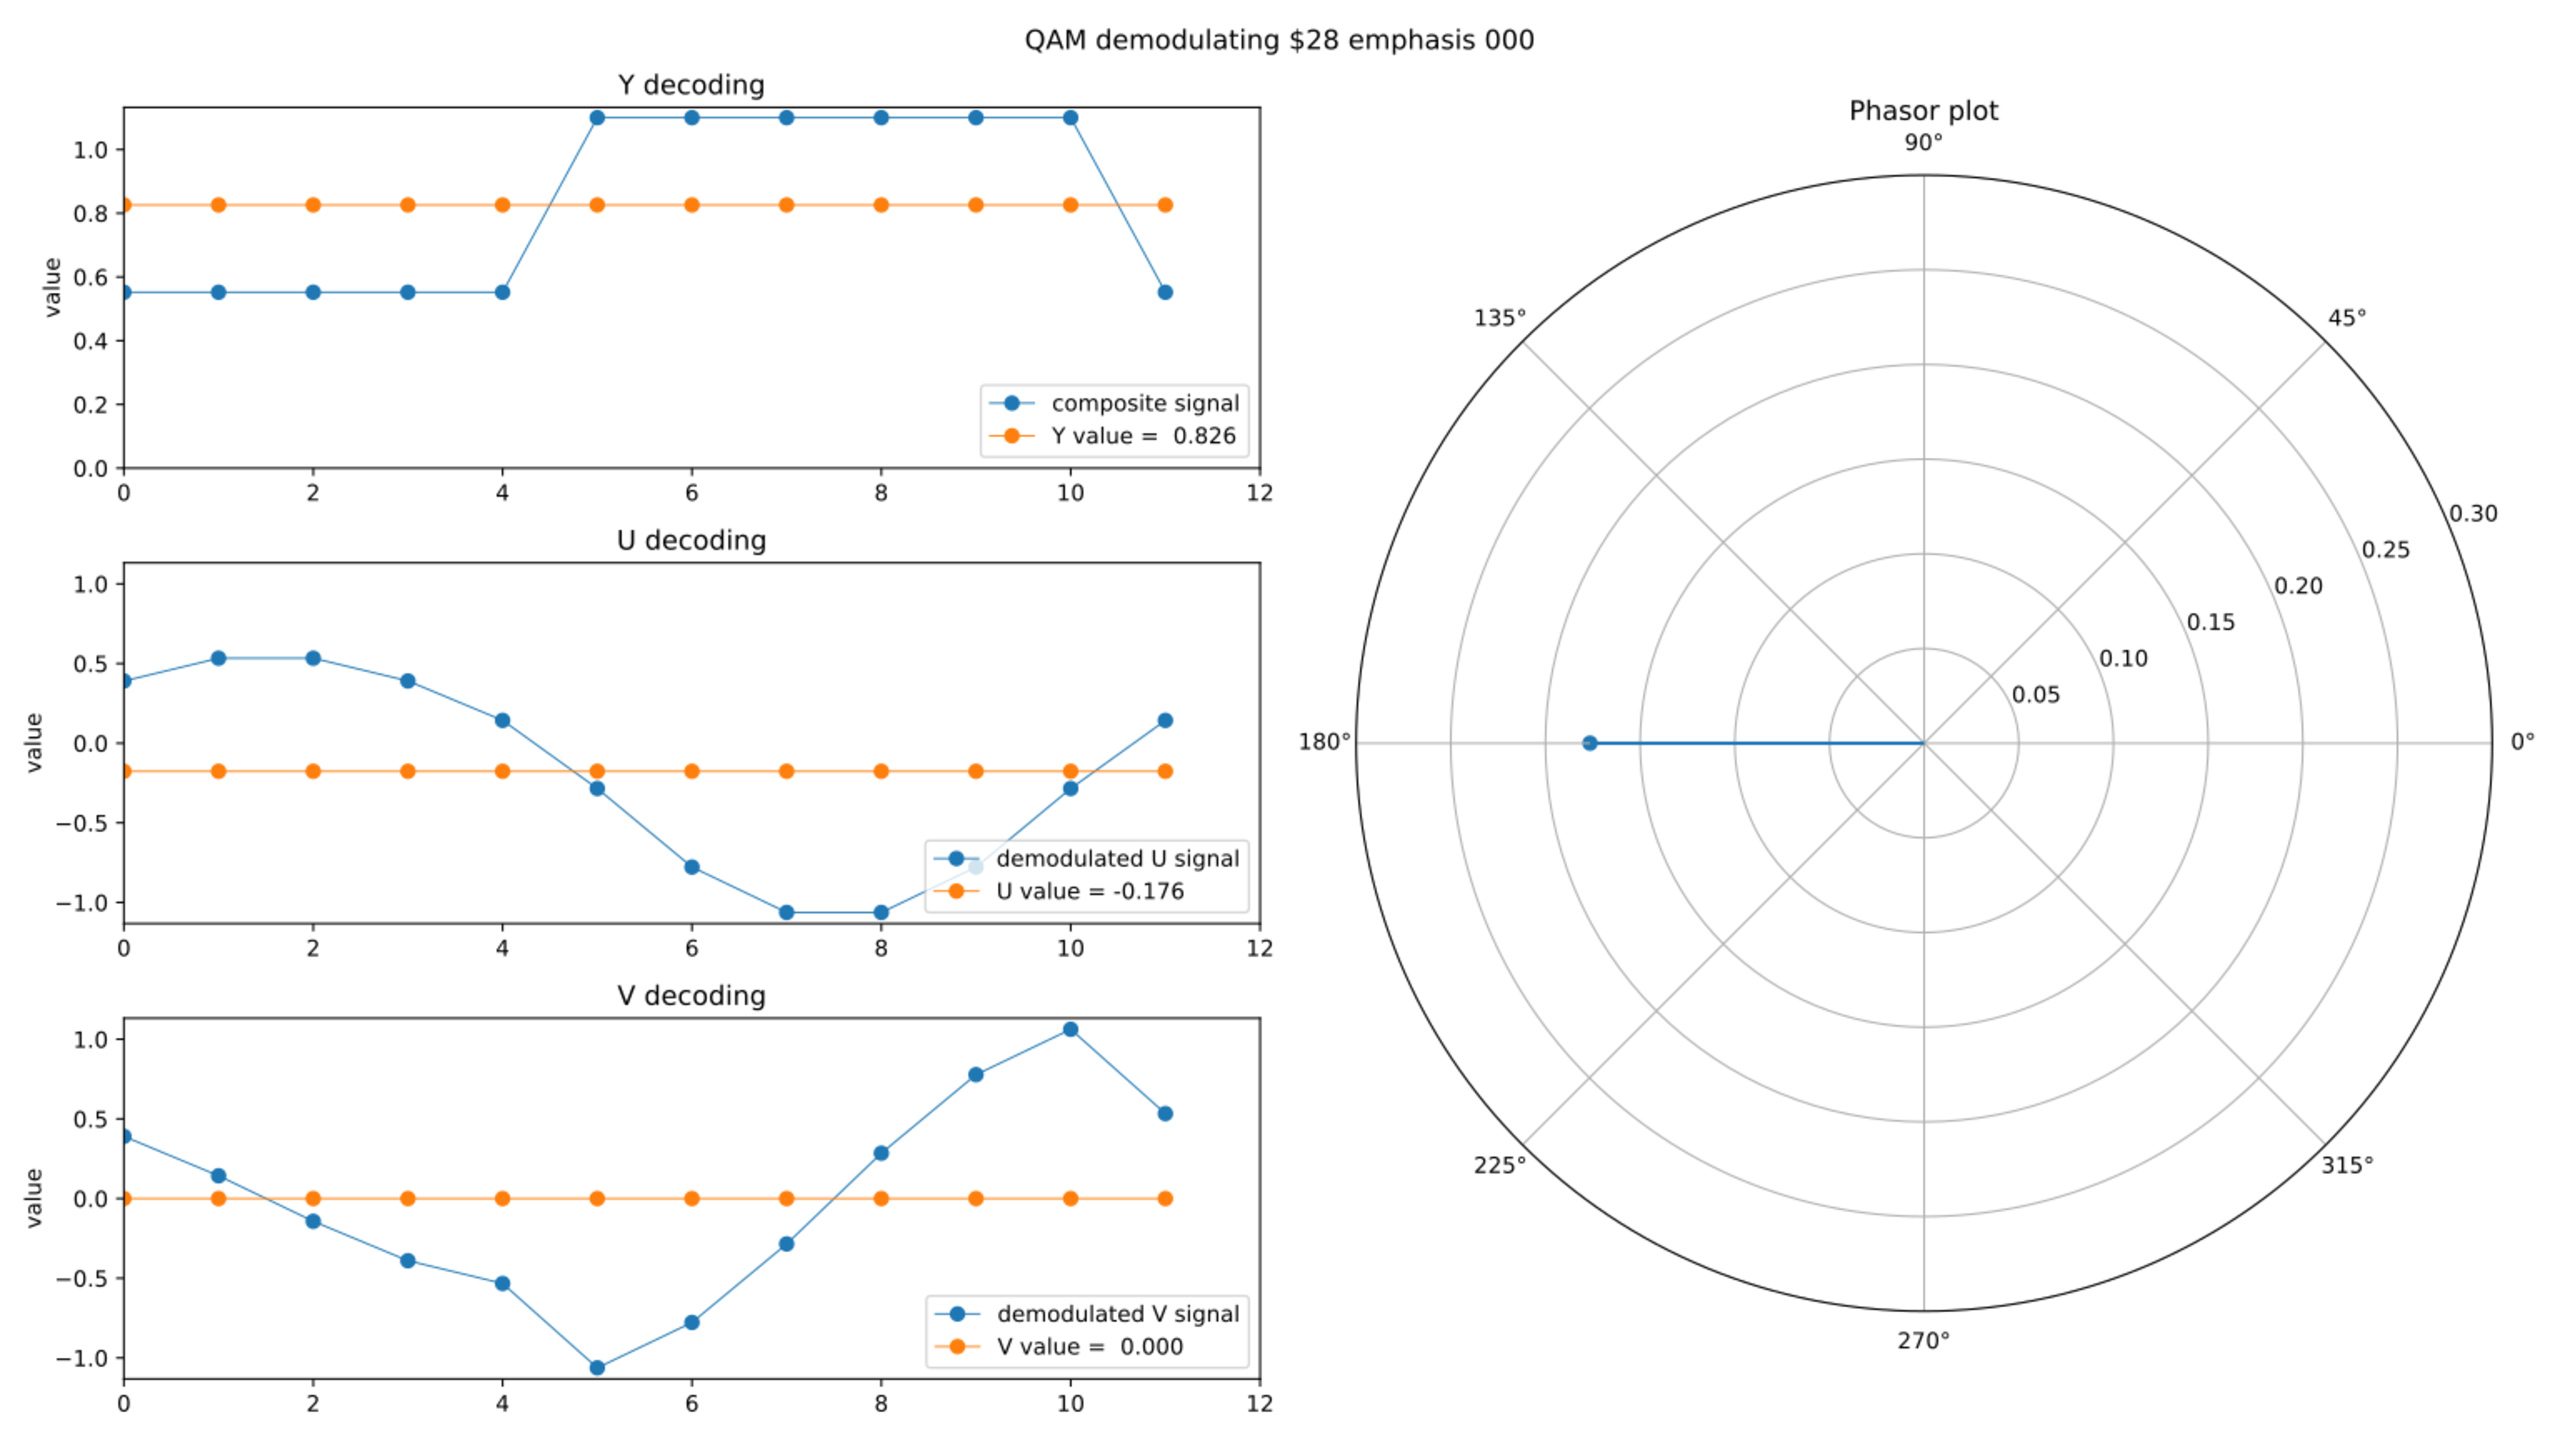
This diagram illustrates quadrature demodulation, used in decoding composite signals to color YUV. More details can be found on the NTSC video page.
The three graphs on the left shows how the Y, U, and V component signals are decoded using the composite signal and a reference carrier wave.
The polar graph on the right shows the resulting color phase and saturation of the decoded color.
The Y component (shown in orange) is decoded by low passing or comb filtering the input signal. (shown in blue)
The U component is decoded by multiplying the composite signal to a reference carrier wave (resulting wave shown in blue.) This signal can then be low passed or comb filtered to obtain the U component (shown in orange).
The V component is decoded in the same way as the U component, but instead with using another reference carrier wave which is phase offset by 90 degrees.
This diagram, and the source code that generates this is distributed under a MIT-0 No Attribution license.
File history
Click on a date/time to view the file as it appeared at that time.
| Date/Time | Thumbnail | Dimensions | User | Comment | |
|---|---|---|---|---|---|
| current | 10:37, 20 May 2023 | | 1,440 × 810 (86 KB) | Persune (talk | contribs) | This diagram illustrates quadrature demodulation, used in decoding composite signals to color YUV. More details can be found on the NTSC video page. The three graphs on the left shows how the Y, U, and V component signals are decoded using the composite signal and a reference carrier wave. The polar graph on the right shows the resulting color phase and saturation of the decoded color. The Y component (shown in orange) is decoded by low passing or comb filtering the input signal. (show... |
You cannot overwrite this file.
File usage
There are no pages that use this file.